
Upper Spey embankment condition assessment - baseline survey 2024
cbec eco engineering
Upper Spey Embankment
Condition Assessment
Final Report Cairngorms National Park Authority cbec eco-engineering UK Ltd January 2025
Services provided pursuant to this agreement are intended solely for the use and benefit of the Cairngorms National Park Authority. No other person or entity shall be entitled to rely on the services, opinions, recommendations, plans or specifications provided pursuant to this agreement without the express written consent of cbec eco-engineering UK Ltd., Suite GF04, Marr House, Beechwood Business Park, Inverness, IV2 3BW.
TABLE OF CONTENTS
Summary ……………………………………………………………………………………… 1
- Introduction ……………………………………………………………………………….. 2 1.1 Study Areas ………………………………………………………………………… 3 1.2 Project TimeLine …………………………………………………………………. 11
- Desk Study ……………………………………………………………………………….. 12 2.1 Topography & LiDAR Analysis ………………………………………………. 12 2.2 SEPA Flood Modelling ………………………………………………………….. 12 2.3 Other Data Sources ……………………………………………………………… 12
- Conditions Assessment ……………………………………………………………… 13 3.1 Background to Bank Erosion and Embankment Breaching ……………. 13 3.2 Methodology ……………………………………………………………………… 14 3.3 Summary of Findings …………………………………………………………… 17 3.3.1. Factors Impacting Riverbank and/or Embankment Stability ……….. 18 3.3.2. Survey Area 1 — Spey Dam to Kingussie ……………………………… 21 3.3.3. Survey Area 2 – Kingussie to Aviemore ………………………………. 40 3.3.4. Survey Area 3 – Boat of Garten to Grantown-on-Spey …………….. 55 3.4 Recommendations ……………………………………………………………….. 74
LIST OF FIGURES
Figure 1.1 Overview map showing the three areas surveyed during the embankment conditions assessment ………………………………………………………………………………….. 7 Figure 1.2 Locations and extents of reaches surveyed within Area 1 ……………………………… 8 Figure 1.3 Locations and extents of reaches surveyed within Area 2 ……………………………… 9 Figure 1.4 Locations and extents of reaches surveyed within Area 3 …………………………….. 10 Figure 3.1. Low-severity riverbank erosion ……………………………………………………………… 16 Figure 3.2 Moderate-severity riverbank erosion ……………………………………………………….. 16 Figure 3.3. High-severity riverbank erosion …………………………………………………………….. 16 Figure 3.4 Low risk of embankment breach. Slumping of the embankment crest appears to have been caused by livestock trampling. The embankment is set back from the riverbank and signs of slumping observed are localised ……………………………………………………………… 16 Figure 3.5 Moderate risk of embankment breach. Situated within 5 m of the riverbank, with slumping and bare ground exposed on the dry side of the embankment ……………….. 16 Figure 3.6 High risk of embankment breach. Embankment positioned along the top of the riverbank. Bare ground and slumping evident across over half of the embankment crest width ……………………………………………………………………………………………….. 16 Figure 3.7. Livestock trampling across the riverbank, leading to soil erosion and loss of surface vegetation …………………………………………………………………………………. 20 Figure 3.8 Bank erosion on the outer bank of a meander is a natural process in meandering channels. Native riparian planting and set-back fencing could promote increased stability in such areas over time ………………………………………………………………. 20 Figure 3.9. Scrub growth on the crest and face of an embankment ……………………………….. 20 Figure 3.10 Young tree growth and regeneration across the crest and face of an embankment ………………………………………………………………………………………….. 20
Figure 3.11 Burrow within the crest of an embankment. Mole hills and burrows were occasionally noted in Areas 1 and 2, but their position and density were insufficient to cause concern at the time of survey ……………………………………………………………………………………. 20 Figure 3.12 Riverbank erosion undermining an embankment positioned at the top of the bank. High risk of embankment breach ………………………………………………………………………… 20 Figure 3.13 Area 1 survey results overview map ……………………………………………………….. 23 Figure 3.14 Area 1 — Map 1 showing the baseline survey results for the River Spey (Reach 1A) …………………………………………………………………………………………………. 24 Figure 3.15 Area 1 — Map 2 showing the baseline survey results for the River Spey (Reach 1A) …………………………………………………………………………………………………. 25 Figure 3.16 Area 1 — Map 3 showing the baseline survey results for the River Spey (Reach 1A) …………………………………………………………………………………………………. 26 Figure 3.17 Area 1 — Map 4 showing the baseline survey results for the River Spey (Reach 1A) and Allt Breakachy (Reach 1B) …………………………………………………………………….. 27 Figure 3.18 Area 1 — Map 5 showing the baseline survey results for the River Spey (Reach 1A) …………………………………………………………………………………………………. 28 Figure 3.19 Area 1 — Map 6 showing the baseline survey results for the Allt Breakachy (Reach 1B) and Fèith Bhuidhe (Reach 1C) …………………………………………………………………….. 29 Figure 3.20 Area 1 — Map 7 showing the baseline survey results for the River Spey (Reach 1A) …………………………………………………………………………………………………. 30 Figure 3.21 Area 1 — Map 8 showing the baseline survey results for the River Spey (Reach 1A) …………………………………………………………………………………………………. 31 Figure 3.22 Area 1 — Map 9 showing the baseline survey results for the River Spey (Reach 1A) …………………………………………………………………………………………………. 32 Figure 3.23 Area 1 — Map 10 showing the baseline survey results for the River Spey (Reach 1A) …………………………………………………………………………………………………. 33 Figure 3.24 Area 1 — Map 11 showing the baseline survey results for the River Spey (Reach 1A) …………………………………………………………………………………………………. 34 Figure 3.25 Area 1 — Map 12 showing the baseline survey results for the River Spey (Reach 1A) and River Calder (Reach 1D) ……………………………………………………………………….. 35 Figure 3.26 Area 1 — Map 13 showing the baseline survey results for the River Spey (Reach 1A) …………………………………………………………………………………………………. 36 Figure 3.27 Area 1 — Map 14 showing the baseline survey results for the River Spey (Reach 1A) …………………………………………………………………………………………………. 37 Figure 3.28 Area 1 — Map 15 showing the baseline survey results for the River Spey (Reach 1A) …………………………………………………………………………………………………. 38 Figure 3.29 Area 1 — Map 16 showing the baseline survey results for the River Spey (Reach 1A) …………………………………………………………………………………………………. 39 Figure 3.30 Area 2 survey results overview map ………………………………………………………. 42 Figure 3.31 Area 2 — Map 1 showing the baseline survey results for the River Spey (Reach 2A) and the Gynack Burn (Reach 2B) …………………………………………………………………….. 43 Figure 3.32 Area 2 — Map 2 showing the baseline survey results for the River Spey (Reach 2A) …………………………………………………………………………………………………. 44 Figure 3.33 Area 2 — Map 3 showing the baseline survey results for the Raitts Burn (Reach 2C) …………………………………………………………………………………………………. 45 Figure 3.34 Area 2 — Map 4 showing the baseline survey results for the River Spey (Reach 2D) and the Insh Marshes Main Drain (Reach 2E) …………………………………………………….. 46 Figure 3.35 Area 2 — Map 5 showing the baseline survey results for the Dunachton Burn (Reach 2F) …………………………………………………………………………………………………. 47 Figure 3.36 Area 2 — Map 6 showing the baseline survey results for the River Spey (Reach 2G) …………………………………………………………………………………………………. 48 Figure 3.37 Area 2 — Map 7 showing the baseline survey results for the River Spey (Reach 2G) …………………………………………………………………………………………………. 49 Figure 3.38 Area 2 — Map 8 showing the baseline survey results for the River Spey (Reach 2G) …………………………………………………………………………………………………. 50 Figure 3.39 Area 2 — Map 9 showing the baseline survey results for the River Spey (Reach 2G) …………………………………………………………………………………………………. 51 Figure 3.40 Area 2 — Map 10 showing the baseline survey results for the River Spey (Reach 2G) …………………………………………………………………………………………………. 52 Figure 3.41 Area 2 — Map 11 showing the baseline survey results for the River Spey (Reach 2G) …………………………………………………………………………………………………. 53 Figure 3.42 Area 2 — Map 12 showing the baseline survey results for the River Spey (Reach 2G) …………………………………………………………………………………………………. 54 Figure 3.43 Area 3 survey results overview map ………………………………………………………. 57 Figure 3.44 Area 3 – River Spey Map 1 showing the baseline survey results for the River Spey (Reach 3A) …………………………………………………………………………………………………. 58 Figure 3.45 Area 3 – River Spey Map 2 showing the baseline survey results for the River Spey (Reach 3A) …………………………………………………………………………………………………. 59
Figure 3.46 Area 3 – River Spey Map 3 showing the baseline survey results for the River Spey (Reach 3A) …………………………………………………………………………………………………. 60 Figure 3.47 Area 3 — River Spey Map 4 showing the baseline survey results for the River Spey (Reach 3A) …………………………………………………………………………………………………. 61 Figure 3.48 Area 3 – River Spey Map 5 showing the baseline survey results for the River Spey (Reach 3A) …………………………………………………………………………………………………. 62 Figure 3.49 Area 3 – River Spey Map 6 showing the baseline survey results for the River Spey (Reach 3A) …………………………………………………………………………………………………. 63 Figure 3.50 Area 3 – River Spey Map 7 showing the baseline survey results for the River Spey (Reach 3A) …………………………………………………………………………………………………. 64 Figure 3.51 Area 3 – River Spey Map 8 showing the baseline survey results for the River Spey (Reach 3A) …………………………………………………………………………………………………. 65 Figure 3.52 Area 3 — River Spey Map 9 showing the baseline survey results for Reach 3A as well as the lower River Dulnain (Reach 3B) …………………………………………………….. 66 Figure 3.53 Area 3 – River Dulnain Map 1 showing the baseline survey results for Reach 3B …………………………………………………………………………………………………. 67 Figure 3.54 Area 3 – River Dulnain Map 2 showing the baseline survey results for Reach 3B …………………………………………………………………………………………………. 68 Figure 3.55 Area 3 — River Dulnain Map 3 showing the baseline survey results for Reach 3B …………………………………………………………………………………………………. 69 Figure 3.56 Area 3 – River Dulnain Map 4 showing the baseline survey results for Reach 3B …………………………………………………………………………………………………. 70 Figure 3.57 Area 3 – River Dulnain Map 5 showing the baseline survey results for Reach 3B …………………………………………………………………………………………………. 71 Figure 3.58 Area 3 — River Dulnain Map 6 showing the baseline survey results for Reach 3B …………………………………………………………………………………………………. 72 Figure 3.59 Area 3 – River Dulnain Map 7 showing the baseline survey results for Reach 3B …………………………………………………………………………………………………. 73 Figure 3.60. Fencing positioned along the dry side (furthest from the channel) of embankments and river corridors to mitigate against trampling by livestock ……………. 77 Figure 3.61 Example embankment breach remedial works. Large wood (trunks with root plates still attached) installed to protect the embankment face (OS NGR NH 88320 09028) …………………………………………………………………………………………………. 77 Figure 3.62. Lowering of the embankment crest to form a spillway (formalised embankment breach) at Breakachy Farm (OS NGR NN 64187 93793) ………………………………………… 77 Figure 3.63 Culvert through the embankment with erosion around the inlet at Drumgask Farm (OS NGR NN 61927 94037) …………………………………………………………………….. 77 Figure 3.64 Culvert with erosion around the outlet at Drumgask Farm (OS NGR NN 61927 94037) …………………………………………………………………………………………………. 77 Figure 3.65 Example of mature trees growing on the embankment and erosion caused by sheltering livestock …………………………………………………………………………………. 77
LIST OF TABLES
Table 1.1 Embankment condition assessment Survey Areas 1 to 3 and sub-reach extents … 4 Table 1.2 Embankment condition assessment programme from 2023 to 2028 ………………. 11 Table 3.1 Criteria used for the assessment of riverbank and embankment condition ……… 15 Table 3.2 Summary of embankment breach risk identified during the 2023⁄24 condition assessment ………………………………………………………………………………………….. 17
SUMMARY
Most of the River Spey is embanked, between the Spey Dam and Grantown-on-Spey, providing flood protection to adjacent agricultural land. The condition and stability of the linear embankment features is under pressure from historical channel straightening, riverbank erosion, movement of flood water, trampling of the embankment surface by livestock or deer, burrowing of mammals, and a lack of riparian (river corridor) vegetation. Increased high flow events associated with climate change are likely to exacerbate riverbank erosion and increase pressure on the embankments, resulting in a requirement for increased preventative and remedial works to maintain the embankment condition.
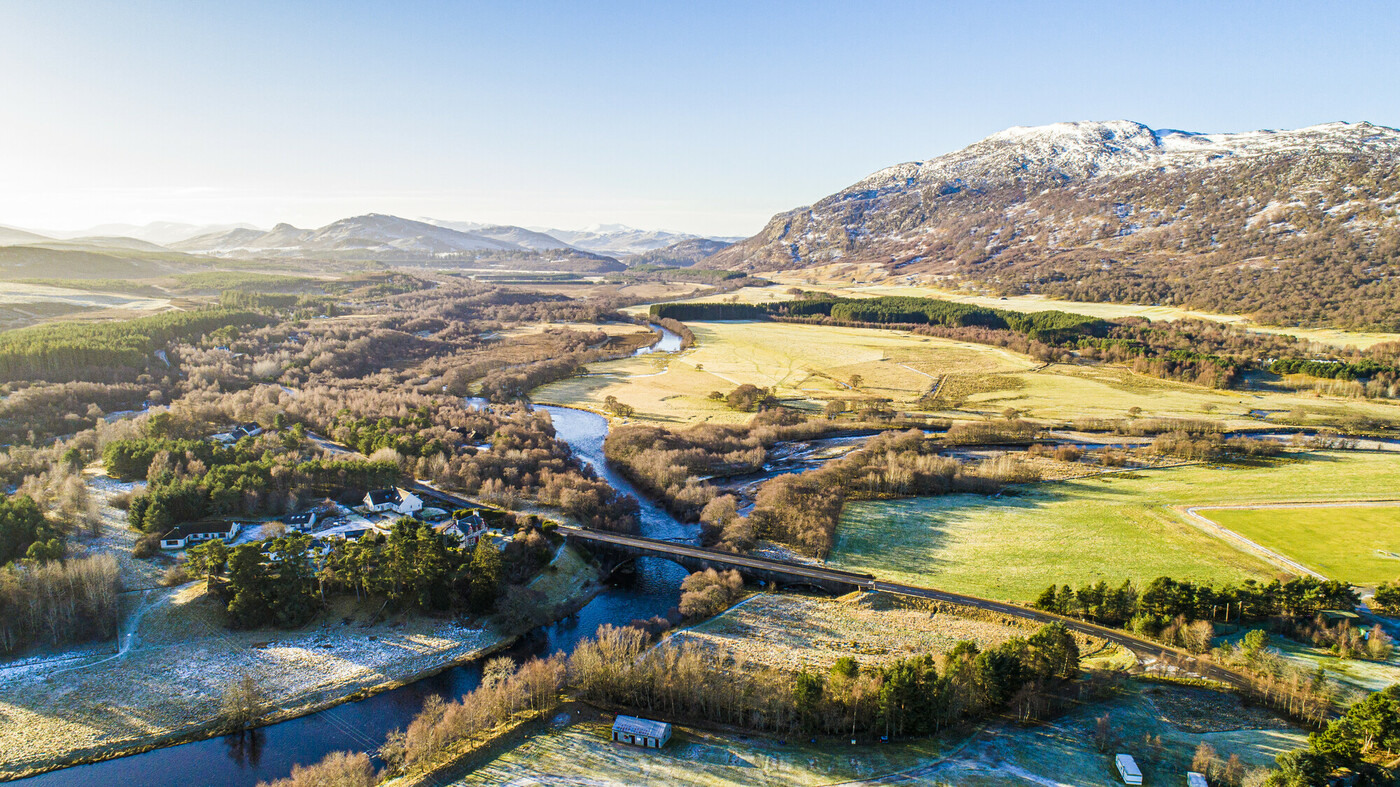
During 2023 to 2024 a baseline assessment of ~67 km channel length of the River Spey and select tributaries was undertaken by cbec eco-engineering UK Ltd. (a river management specialist), on behalf of the Cairngorms National Park Authority (CNPA). The study area extended from the Spey Dam to Grantown-On-Spey, encompassing a cumulative embankment length of ~71.14 km. Of this total length, ~83.6% was noted to be in good condition at the time of survey (autumn 2023 and autumn/winter 2024). Signs of erosion on the embankment, indicating a high risk of breaching, were limited to ~1.2% (~0.87 km of embankment cumulatively) of the total length surveyed and ~1.6% (~1.14 km of embankment cumulatively) was found to have already breached. A breach refers to a section of embankment which has been compromised, allowing floodwater to pass through onto adjacent land. Sections at high risk of breaching may present signs of instability such as cracks, slumping or areas of exposed bare ground on the embankment face or crest. These areas at high risk of breaching are likely to be near the riverbank (e.g. less than 5m) or adjacent to an existing breach.
This baseline assessment of the embankments will enable any changes in condition, for example stabilisation, no change or deterioration, to be documented over the duration of this project.
Recommendations were proposed to help reduce the risk of erosion on the embankments in the future, these included:- riparian planting and vegetation management to promote bank stability within the river corridor; fencing to prevent trampling by livestock and deer; a natural flood management study to identify other opportunities within the study site and wider catchment to reduce flood risk; remedial works to repair locations where the embankment has been breached and locations identified as being at high risk of erosion; installation of flap valve culverts within the embankment to facilitate drainage of the fields post-flood and continued monitoring. Subsequent annual surveys, proposed for 2025 to 2028, will target areas identified as being at risk of erosion, where breaching of the embankment is likely to or has taken place and areas of concern highlighted by landowners and/or the CNPA.
1. INTRODUCTION
An embankment is a linear mound of compacted material constructed to protect land from river flooding. The River Spey, as it flows between the Spey Dam and Grantown-on-Spey, is embanked on either one or both of its banks, throughout much of its length. These sections of the Spey embankments serve to protect the adjacent agricultural land primarily as well as contributing to the flood resilience of some residential properties and access routes.
cbec eco-engineering UK Ltd (cbec) was commissioned by the Cairngorms National Park Authority (CNPA) to undertake a high-level assessment of the condition of flood embankments and riverbanks along the River Spey and select tributaries. A cumulative channel length of ~67 km was selected for annual assessment, extending between the Spey Dam, near Laggan and Grantown-on-Spey, over a 6‑year monitoring period between 2023 and 2028. The aim of the conditions assessment is to provide baseline information on the current condition of the embankments, identifying locations where the embankment has already been breached and areas at imminent risk of erosion and/or potential breaching. The degree of erosion to the riverbanks within the study area will also be assessed, particularly where it has potential to undermine an embankment. The assessment will also be used to guide requirements for any future management/maintenance, topographic survey and flood modelling requirements.
Erosion is a natural river process enabling channel adjustment, particularly in meandering channels such as this section of the River Spey. However, it is understood that riverbank erosion may be undesirable in certain locations for example, in the proximity of a flood embankment which may be undermined by bank retreat. Historical straightening of sections of the Spey is likely to have led to over deepening and instability of the channel banks which in turn may impact embankments within close proximity (i.e. less than ~5 m) of the bank. Situated within the river corridor, embankments are also subject to erosion from out of bank flow during flood events, where water flows towards, over or is held behind the bund. More frequent high flow and flood events resulting from climate change are likely to increase erosion risk to the embankments in the future. The factors outlined above will increase wear and tear and exacerbate the risk of erosion on the embankments which will ultimately increase the requirement for regular maintenance of the embankments.
Signs of erosion on